
We have realtime monitoring in the panel, but it would be cool to see this over time in graphs.

Similar to: https://roadmap.ploi.cloud/projects/3-applications/items/78-show-history-of-instance-monitoring-values

Merged Show history of instance monitoring values into this item \n\n Created by: Alex Bouma \n\n I have a pretty expensive cron running in the night time. I know I have enough resources because it didn't crash but I don't know if I overprovisioned or it's right on the edge. With some historical data of the instance monitoring values (cpu/ram/disk) this would be super easy to figure out.

There's a simple version of this live, but as it is right now it doesn't add as much as I would hope.
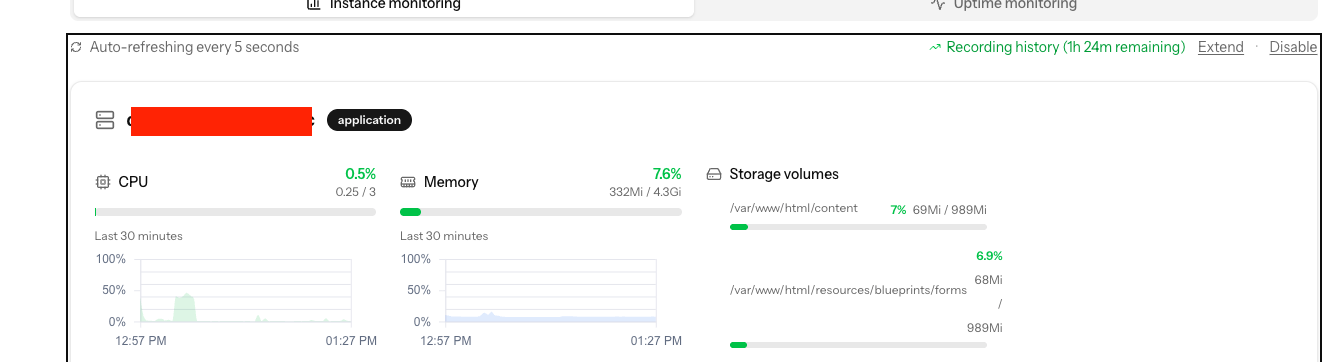
In this example here, i've enabled the monitoring for several hours (for 6 hours, 1 hour 24 min remaining so it's been active for 4,5 hours), but I can only see the last 30 minutes in the graphs. This makes it really hard to figure out what exactly is spiking memory usage for example unless it happened within the last 30 minutes (and i have enabled monitoring within the last 6 hours).
I know the debug tab also shows critical cases like out of memory issues, but for keeping an eye on how many resources would be an optimal zero-state it's hard to use right now.
Would it be possible to show the graphs for the entire time that the monitoring is active?
Monitoring over time (graphs)


-
Dennis moved item to board Live
1 month ago -
Dennis moved item to board In progress
1 month ago -
Dennis moved item to board Planned
1 month ago -
Zander van der Meer moved item to board Under review
7 months ago -
Dennis van Dalen moved item to project Panel
7 months ago -
Dennis van Dalen created the item
7 months ago